Abnormal
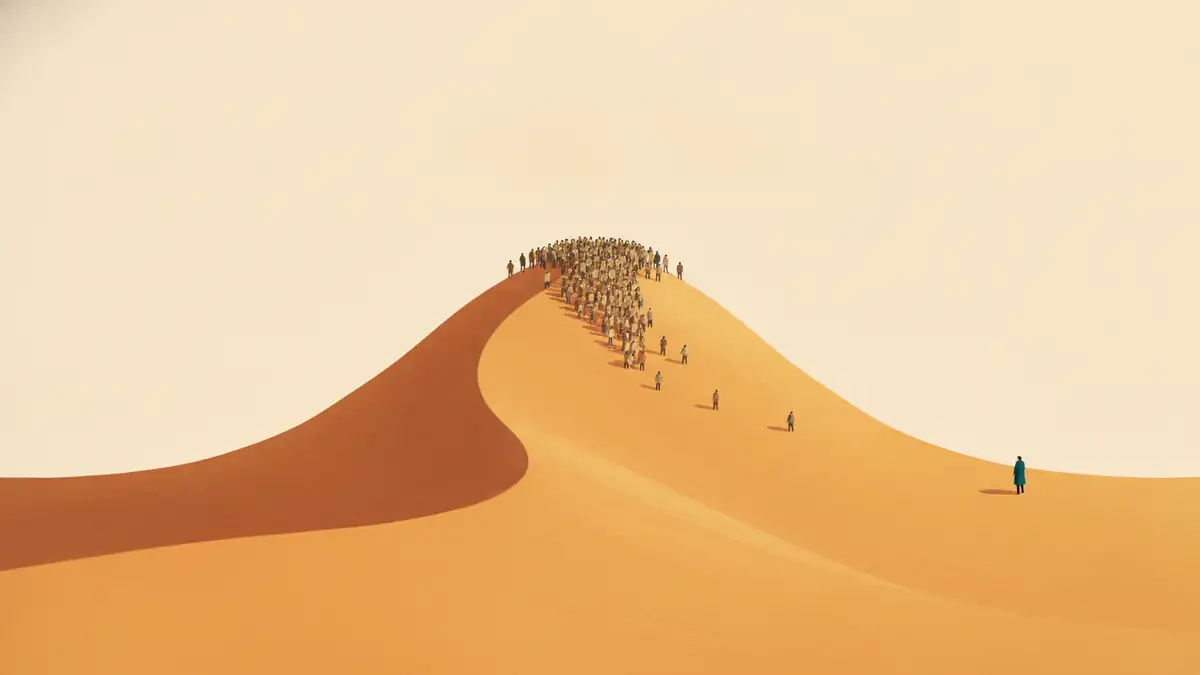
"Normal" is a word from statistics that we turned into a life goal. Look at the actual shape of the curve and the goal mostly falls apart.
TL;DR
- On a real bell curve, normal is the crowded middle. The people and ideas that matter tend to live in the tails.
- Contrarian thinking is a deliberate search of the thin end of the "what people believe" distribution.
- With two peaks, a power law or a flat line, "normal" stops meaning anything at all.
- Measure enough traits and nobody is average: the Air Force found zero average pilots out of 4,063.
- Normal moves over time, and the outliers are how a population adapts.
In 1920 Karl Pearson admitted he'd made a naming mistake. Years earlier he had started calling the bell-shaped Gaussian curve the "normal" curve. The name stuck, and Pearson noticed the side effect: people started believing that every other distribution was, in some sense, abnormal. He added that this belief wasn't justified.
A century later we still use the word that way. Normal weight, normal job. Normal as the safe middle, the thing to aim for. I think most of the time that's the wrong target, and sometimes it isn't even a meaningful one. Here's why, in the language of the thing Pearson named.
The middle of the bell is the crowded part
Take a real bell curve. Height, test scores, reaction times, measurement errors. Being normal means sitting in the fat middle where most people are. That's fine if you want to blend in. It's useless if you want to be chosen for anything.
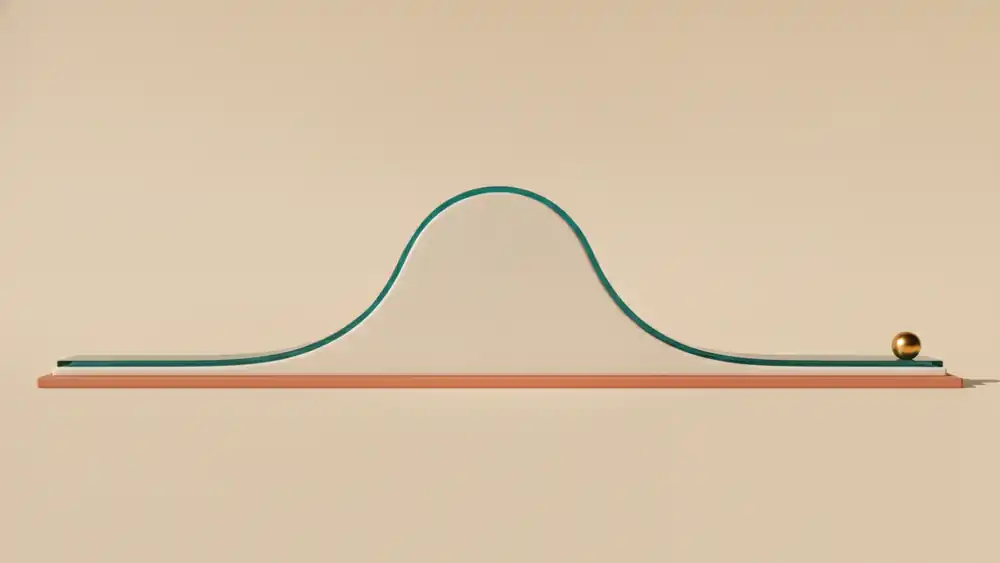
Nobody picks the median sprinter for the Olympics. And the people out in the tails often don't look like they belong there at first. Usain Bolt is 1.95m, and for years the assumption was that he was too tall for the 100m, because tall sprinters are slow out of the blocks. Michael Phelps has a wingspan longer than his height, a long torso and short legs. On most measures that's an awkward body. In a pool it's close to ideal.
Their bodies were abnormal. That was the point.
Abnormal ideas
Now draw a different histogram. On the x-axis, every idea about how the world works. On the y-axis, how many people believe it. Most of the mass sits on consensus. Contrarian thinking is the deliberate habit of looking at the thin end, the ideas very few people hold.
Most of those ideas are wrong. A few aren't, and those few are where the big wins hide, because nobody else is competing for them.
In the early 1980s, everyone knew stomach ulcers came from stress and acid. Barry Marshall, a young doctor in Perth, and the pathologist Robin Warren thought a bacterium was responsible. Nobody believed them. Marshall couldn't get the bug to infect piglets, so in July 1984 he had an endoscopy to confirm he was clean, then drank a broth of cultured Helicobacter pylori. Within about a week he had gastritis, and antibiotics cleared it. Marshall and Warren shared the Nobel Prize in 2005, and ulcers went from a chronic condition to something treated with a short course of pills.
Dan Shechtman saw a crystal pattern on April 8, 1982 that textbooks said was impossible. The head of his research group told him to go read the textbook, then asked him to leave. Linus Pauling, a two-time Nobel laureate, campaigned against him for years and liked to say there were no quasicrystals, only quasi-scientists. Shechtman won the Nobel for quasicrystals in 2011.
It doesn't always end well. Ignaz Semmelweis showed in the 1840s that doctors washing their hands sharply cut deaths in maternity wards. He was ridiculed and died in an asylum before germ theory proved him right. Living in the tail of the idea distribution has a cost. It's still where the important stuff starts.
Peter Thiel's favorite interview question is basically a request to point at that tail:
What important truth do very few people agree with you on?
When there's no bell at all
Here's the part that bothers me most. "Normal" only means something when the distribution has one peak in the middle. A lot of distributions don't.

Some have two peaks. Old Faithful in Yellowstone erupts either about 65 or about 91 minutes after the previous eruption, depending on how long that one lasted. Ask for the "normal" interval and you get a number in the gap that rarely happens. American politics looks more and more like this, with two humps that have been pulling apart for decades and smaller bumps for libertarians and others. The average voter sits in the valley, where hardly anyone actually lives. (The extreme version: the average human has roughly one ovary and one testicle.)
Some distributions are power laws. City sizes, book sales, earthquakes, wealth, YouTube views, Amazon sales. A handful of outcomes are enormous and the long tail is tiny. The "average book" sells a number that describes almost no actual book, because a few bestsellers drag the mean up. In a world like this there's no hump to stand on, so there's no normal to be.
And some are flat. Birthdays are spread almost evenly across the year. Nobody has an abnormal birthday. The digits of pi show up equally often. Asking which one is normal is a category error.
Switch between the shapes below and watch where the average lands, and how many cases actually sit near it.
So before worrying whether something is normal, it's worth asking what the curve actually looks like. Often the honest answer is that the word doesn't apply.
Nobody is average in ten ways at once
In 1950 the US Air Force had a problem. Planes kept crashing, and pilot error didn't explain it. The cockpits had been designed around the average pilot measured back in 1926, so the Air Force remeasured, and Lieutenant Gilbert Daniels, fresh out of Harvard, got the data for 4,063 pilots.
Daniels picked the ten dimensions that mattered most for cockpit design, things like height, chest circumference and sleeve length. He defined "average" generously, as the middle 30% on each one. Then he counted how many pilots were average on all ten.
Zero.
It gets worse with fewer dimensions than you'd think
Even if you only look at three of the ten measurements, fewer than 4% of the pilots were average on all three.
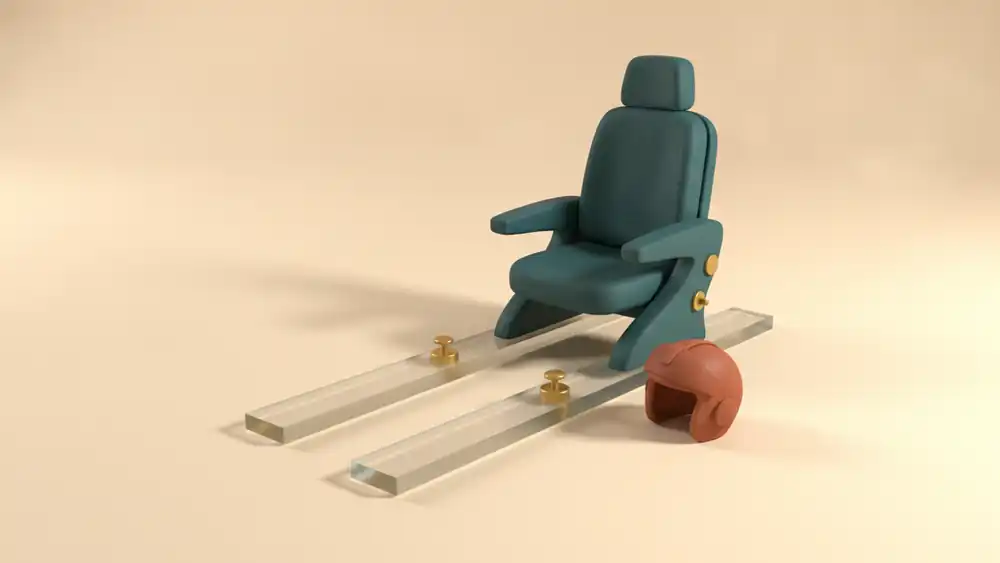
The average pilot didn't exist. The Air Force stopped designing for him and started demanding adjustable seats and pedals. That's why your car seat slides.
Cleveland ran a gentler version of the same experiment in September 1945. The local Health Museum and the Plain Dealer newspaper held a contest to find the woman who matched "Norma," a statue sculpted from the averaged measurements of 15,000 young American women. Thousands sent in their measurements. The prize went to a 23-year-old theater cashier, but she wasn't a real match either, and the takeaway was that a statistically normal woman didn't exist.
Every trait you have puts you somewhere on a curve. Stack enough curves and everyone ends up in a strange corner. Being normal in every dimension is the rarest thing of all.
That also works in your favor. You don't need to be in the top 1% at anything to be unusual. Being pretty good at two or three things that rarely go together puts you in a corner of the joint distribution that's nearly empty.
Pick your histogram
Whether you're abnormal depends on who you're compared to. A 2.10m man is a curiosity on the street and unremarkable in an NBA locker room. A strange obsession is strange in your town and ordinary in the right online community. You can't easily change your position on a curve. You can often change the curve.
Normal moves
The curve itself drifts, too.

Before the Industrial Revolution, the dark form of the peppered moth was a rare oddity in England. Pale moths blended into lichen-covered bark and dark ones got eaten. Then soot blackened the trees around the factory towns. By 1895, about 98% of peppered moths around Manchester were dark. The abnormal moths were the ones that survived. And when the air got cleaner in the second half of the 20th century, the pale form came back. Normal flipped, then flipped again.
People are no different. In Britain and the US, left-handedness bottomed out around 3% for people born near 1900, when left-handed kids were routinely made to switch. For people born after about 1950 it's around 11%. The psychologist Chris McManus, who has spent decades on this, thinks the stigma did more than change which hand kids wrote with: left-handers had fewer children, so fewer of the relevant genes got passed on. Normal was being enforced, and it showed up in the numbers.
That's the real case for the tails. A population where everyone sits in the middle is fragile. Variation is what lets a species or a company adapt when the environment changes. The outliers are the backup plan.
So if you don't fit the curve, or the curve you're on has no middle, or you're far out on its edge, that's fine. Pearson was right to regret the word. Most of the interesting things in the world were abnormal first.
Further reading
- Karl Pearson on naming the "normal" curve (1920)
- Lt. Gilbert S. Daniels and the myth of averages
- Gilbert Daniels, the gardener who changed our world (ASU)
- From Norma and Normman to Kim and Caitlyn
- Helicobacter pylori: A Nobel pursuit? (Barry Marshall interview)
- Vindicated: Ridiculed Israeli chemist wins Nobel (NBC News)
- Model for the eruption of the Old Faithful geyser (GSA Today)
- Peppered moth evolution
- Caught on film: lefties were rare in 19th-century England (Scientific American)